Use application verifier to debug deadlock
Recently we faced an issue, after upgrading some components, the game client was not able to start occasionally, we still can see the game client process in the taskmgr.exe when this bug occurred, but the UI did not show, and the game client has anti-debug components, we cannot use a debugger to debug it. so I’m gonna talk about how to use Application Verifier to find the root cause of this bug.
Take a peek
Because we cannot use a debugger to debug it, we use taskmgr.exe to dump the memory of the game client process, then we use Windbg to do dump analysis, and we found there is only one thread whose start address is within the game client EXE, the thread number in Windbg is 0, and usually thread 0 is the main UI thread in Windbg, call stack as below.

we can see, the main thread called SetUnhandledExceptionFilter, which then try to acquire a SRWLock called kernelbase!BasepUEFLock, but this lock is owned by other thread, so the main thread is waiting, but who owns the lock and why it didn’t release the lock, the key point here is, for CRITICAL_SECTION, we can use !cs command to find who owns the CRITICAL_SECTION, but for a SRWLock, we cannot do that, the definition of SRWLock as below.

though the SRWLock is very effective, it contains limited information, it’s just a pointer, and the object start address is 16 aligned, it uses bit 0~3 to record the state of the lock, it does not keep the owner information. from the name “kernelbase!BasepUEFLock”, we can guess it has something to do with UnhandledExceptionFilter, after checking all other thread stack traces, we cannot find any suspicious threads, the thread who owns the lock may already exit or was killed, it’s impossible to find the call stack of a killed thread from the dump
Application Verifier
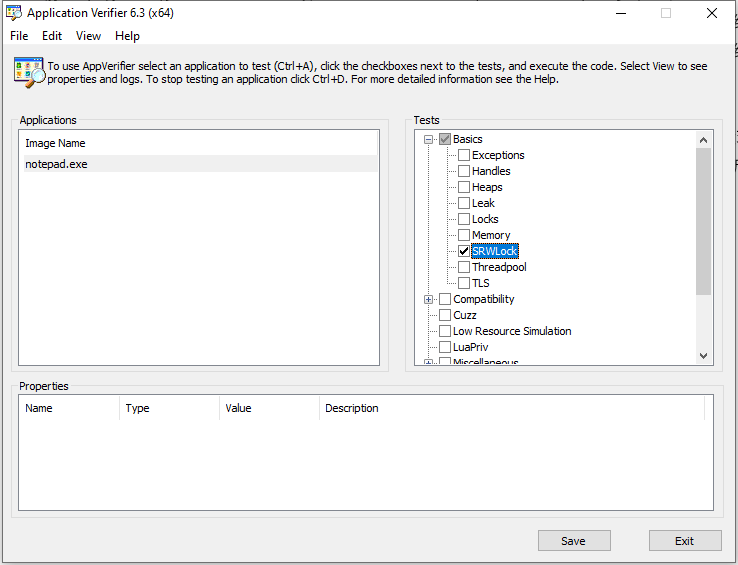
Application Verifier is a tool provided by Microsoft, aimed at assisting developers in quickly finding subtle programming errors that can be extremely difficult to identify with normal application testing. like invalid handles, heap overflow, double free, lock not initialized, etc. UI as below.

after installing the Application Verifier, there are two executables, use 32bit version for 32bit applications and 64bit version for 64bit applications, on the top left, you can add applications that you want to check by right-clicking in the box, and the top right offers the items to be checked based on your needs, for some items like Heaps, you can config which Dll to check and full page heap or normal page heap in the properties window.
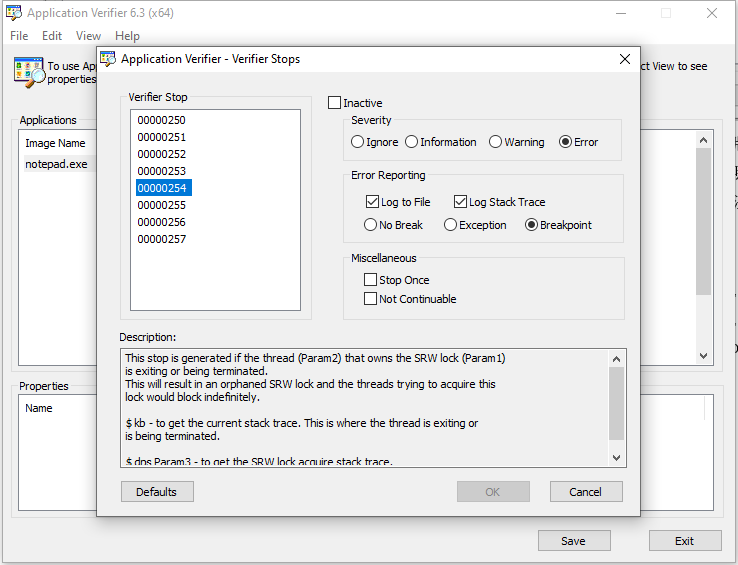
Here we only select the SRWLock checkbox, for most of the cases, it is required to run the application in a debugger, when it detects any problems, it reports the problem to the debugger, and we can then use !avrf to check the cause of the problem, since we cannot use a debugger to debug the game client, we need to change an option, right-click on the SRWLock checkbox, then select “Verifier Stop Options”, the config window as below.

just like exception code, there is also a code called Verifier Stop for every issue the Application Verifier reports, take a look at the description of code 00000254, when it detects a thread who owns a SRWLock is exiting or being killed, it will report to the debugger, the “Log to File” and “Log Stack Trace” option means it will log the call stack into a log file, and below it, there are three radio box
Not Break: do not break into the debugger
Exception: throw an exception
Breakpoint: execute a breakpoint instruction
since we cannot run the game in the debugger, if we choose “Breakpoint”, the game client will exit directly when the Application Verifier detects this issue, here we choose “No break”, so we can dump the memory of the game client process when the deadlock occurs. and use “dps Param3” command to get the SRWLock acquire stack trace.
after doing this, we can click save and exit the Application Verifier, the Application Verifier will store all the configurations in the registry, whenever you start the “to be checked” application, few dlls will be injected into the application and hook some APIs to do these basic checks. after finishing testing, you should reopen the Application Verifier to remove those application configurations.
Dive into it
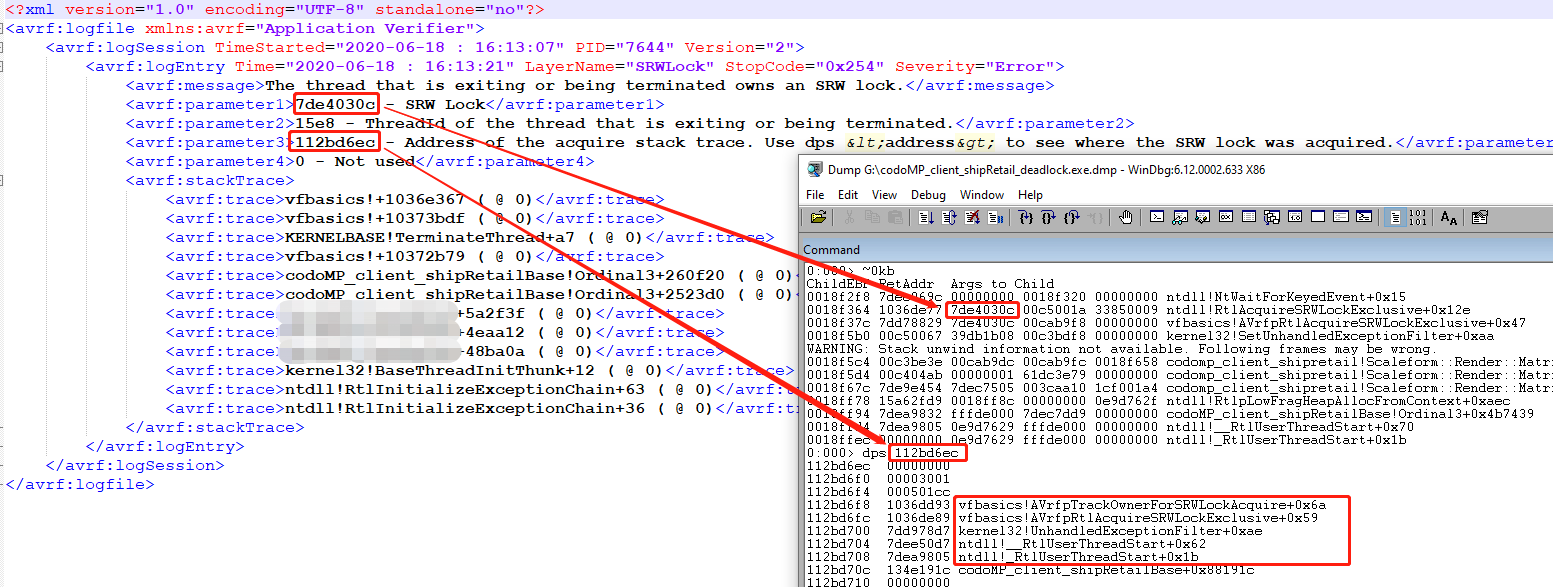
Then we try to reproduce the bug, after retried several times, the bug reproduced, then we use taskmgr.exe to get the dump for later use. the logged stack trace file is in %temp% directory, every time you start the application, one XML file is generated in the %temp% directory, you can open the XML file directly or open Application Verifier and click “View—>Logs” to read the XML file.

we can see the SRWLock(7de4030c) is exactly the lock that the game client main thread is waiting for, the Tid of the thread who owns the lock is 15e8, the vfbasics.dll is one of the few verifier Dlls that are injected into the game client process to do basic checks. the thread 15e8 owns the lock but is been terminated before it releases the lock, because we only have a dump, and when we dumped, this thread is already been terminated, so we cannot get the stack trace of thread 15e8. but if we can run the application in a debugger, when Application Verifier reports this issue, the thread is still alive, and we can still check the stack trace. the bottom right is the stack trace when thread 15e8 was acquiring the SRWLock.
Last
we can see it’s really dangerous to use the API TerminateThread, because the resources acquired by the thread cannot be released after we kill it. Application Verifier is really useful and powerful, there is also a tool called Driver Verifier which is used to verify drivers, whenever it detects a driver issue it will cause a BSOD. making use of these verifier tools can help us to build more stable and secure products.
