Windows Performance Toolkit - why git for windows so slow?
In this article, I’m going to talk about how to use WPT(Windows Performance Toolkit) to analyze CPU problems of programs
Background
A few days ago, I was coding happily, and when I prepared to push the codes to the server, I right-clicked in the explorer of the project, selected “Git Bash Here”, then I waited, waited, waited, almost 10 seconds later, I was able to type commands in the git bash. It was really a bad experience, so I decided to dig into it
Windows Performance Toolkit
The Windows Performance Toolkit is the most powerful performance analysis tool provided by Microsoft for free, It consists of two independent tools: Windows Performance Recorder (WPR) to record performance data, and Windows Performance Analyzer (WPA) to analyze the performance data collected by WPR. like Perf and FlameGraph in Linux, the latest version of WPA is also able to show CPU usage in Flame graph.
WPR is based on ETW (Event Trace for Windows), different windows kernel components register themselves as kernel providers, when the provider is enabled, the corresponding kernel component will write performance data into the kernel ring buffers, then the consumers are able to read them from the ring buffers, when providers are disabled, they have no cost to the system, just like Tracepoint in Linux
WPA user interface as below, it can be used to analyze different performance problems, like CPU usage, Memory leak, Interrupt, Storage, etc.
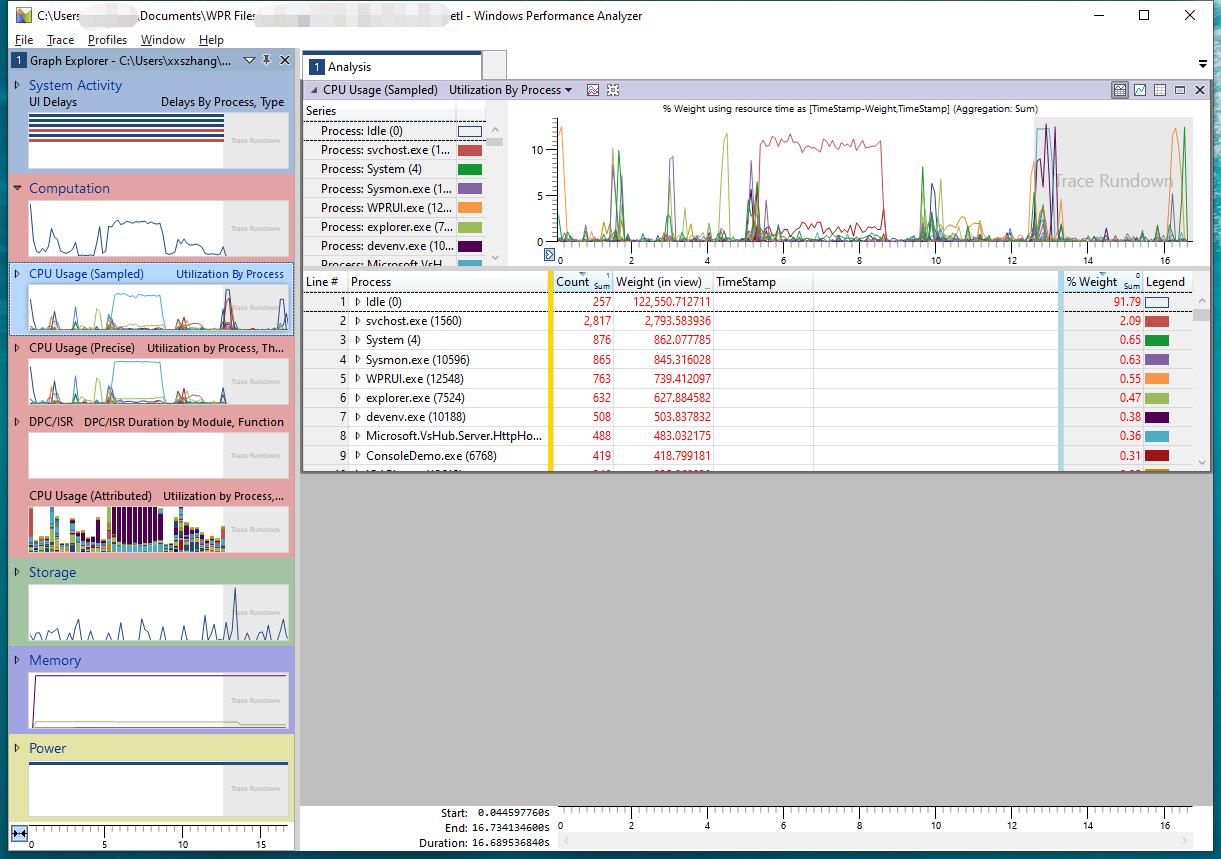
on the left of the panel, there are different performance graphs, the performance data behind different graphs come from different kernel providers, you can drag the graphs to the right panel to do analysis. on the top right of the panel is the timeline, you can select a time interval and zoom to see things happened only in that time period, the most commonly used graphs are CPU Usage (Sampled) and CPU Usage (Precise)
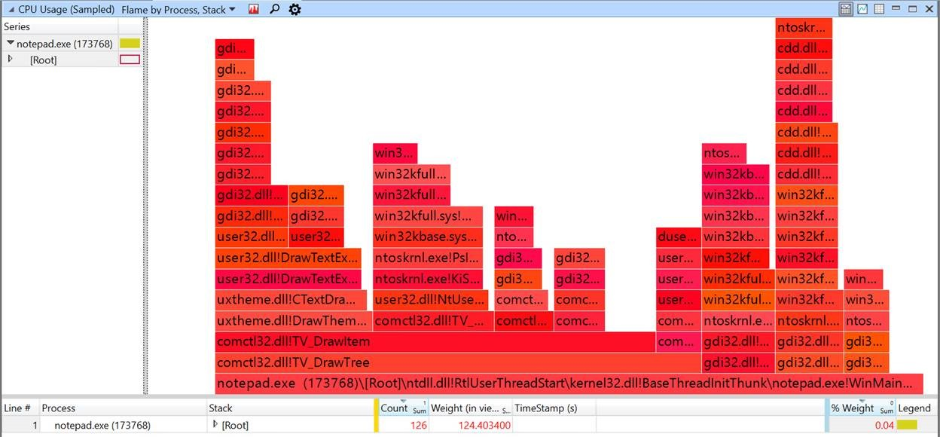
CPU Usage (Sampled)
The performance data behind this graph come from timer interrupts, samples of CPU activity are taken at a regular sampling interval, so this graph is very useful to analyze high CPU usage related problems, to find hot functions and call stacks
CPU Usage (Precise)
The performance data behind this graph come from the scheduler of the operating system, the scheduler knows exactly when one thread is scheduled out and which one is scheduled in, and how long a thread spends on each state, etc. It is quite useful when we analyze the responsiveness of programs.
Running: Significant running times usually indicate high CPU usage, we should use CPU Usage (Sampled) graph to find the hot functions.
Ready: Time spent in the ready state indicates that other threads are using CPUs, and prevent current thread from executing.
Waiting: if a thread spends most of its time on this state, then we need figure out what it is waiting for, if it is waiting for another thread, then we must analyze time spent on each state for that thread, if that thread has significant running times, then we can use CPU Usage (Sampled) to figure out its hot functions and call stacks.
The key point to resolve long delays of a program is to find out the critical path, because a program can have a lot of threads, some of them are parallel, optimizing them will not reduce the long delays, while some are sequential and are on the critical path, optimizing them can significantly improve the responsiveness of a program, nowadays programs are more and more complicated and many threads involved, it is usually not that easy to find out the critical path.
Collect performance data
Back to our topic, to collect performance data of git for windows, we use WPR, WPR can collect a lot of performance data, usually, we only enable necessary providers according to the problems we faced, here we pick First Level triage and CPU usage, if you scroll down the list, you can see some common scenarios, and pick them the WPR can automatically enable the necessary providers.
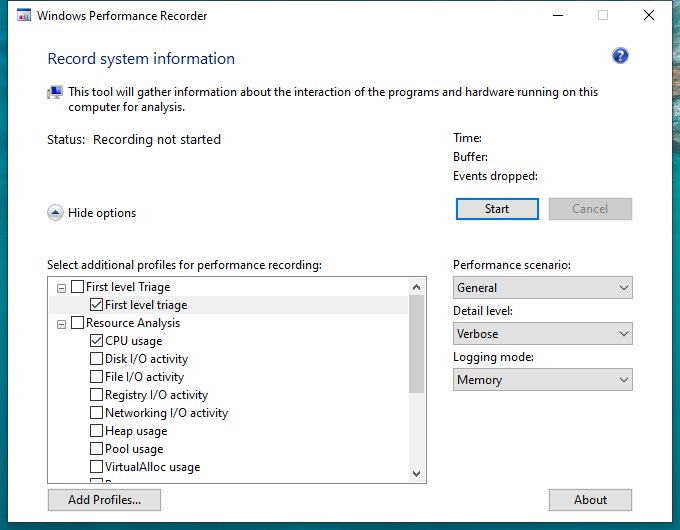
Click the start button, the WPR starts to collect performance data of the whole system, then we need to reproduce the problem, so right-click in the explorer, select “Git Bash Here”, when the bash is ready and we are able to type commands, click the stop button to stop collecting performance data, the rest of the work is done in WPA.
Which process to analyze
Because WPR collected performance data of the whole system, we need to filter to a specific process to analyze, there are three processes related to git bash, we use Process Explorer to observe the whole process, when we right-click “Git Bash Here”, the explorer.exe creates git-bash.exe, git-bash.exe creates mintty.exe, then mintty.exe creates bash.exe, this bash.exe then creates child bash.exe multiple times, some of the child bash.exe even creates several their child bash.exe. a few seconds later, all the bash.exe exits, only the first bash.exe left, at this time, finally I can type commands, so the problem is most likely related to the first bash.exe.
Bash.exe analysis
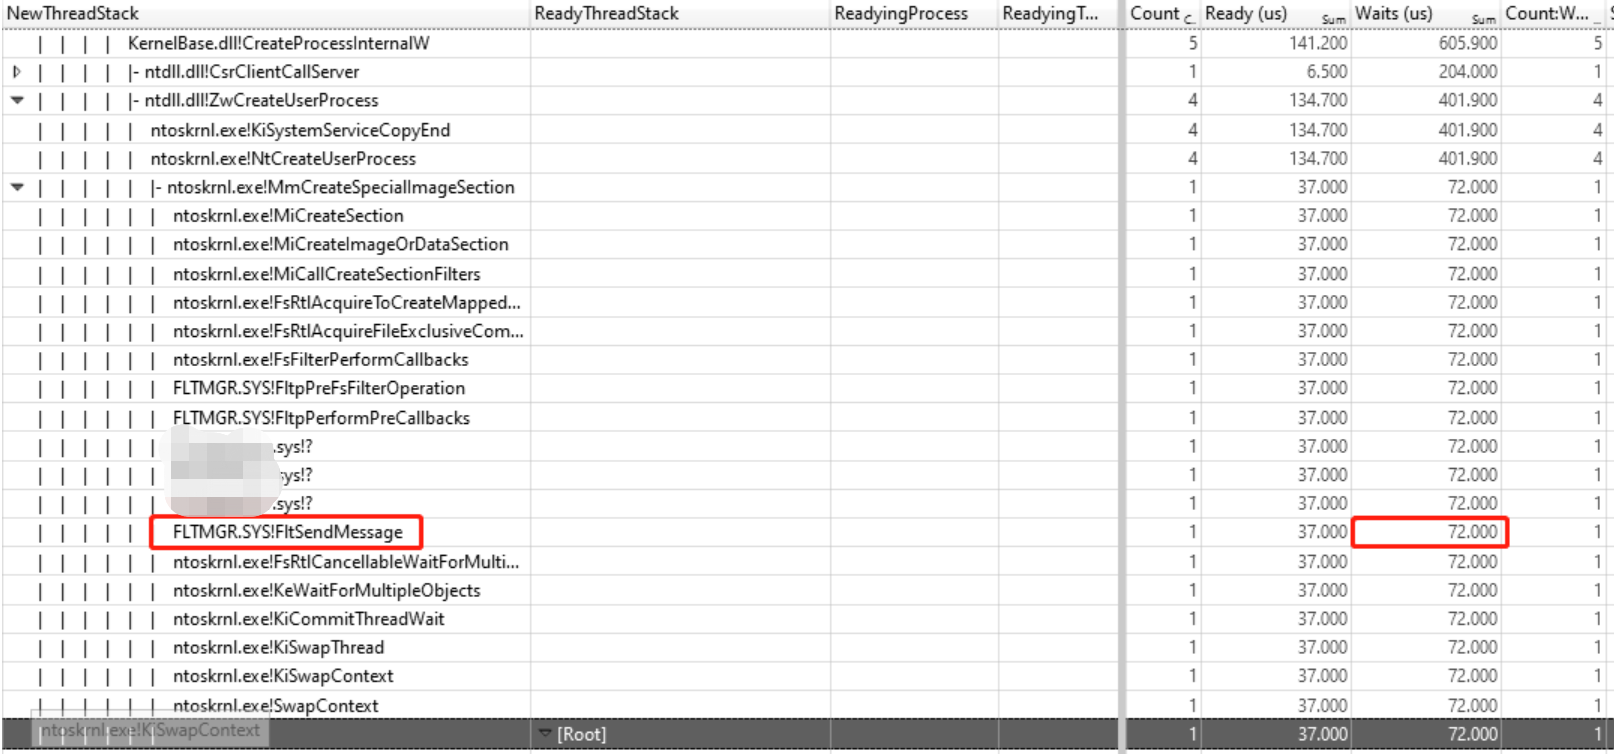
I observed that the CPU usage of the several bash.exe is not high, and the load average of the whole system is also not high, so probably the bash.exe is waiting for something, we use CPU Usage (Precise) graph to do analysis. drag the CPU Usage (Precise) graph to the right panel, Right-click on bash.exe then select “Filter To Selection”, click on Waits (us) Sum to sort the threads, then analyze the call stacks of these threads, one call stack catches my attention
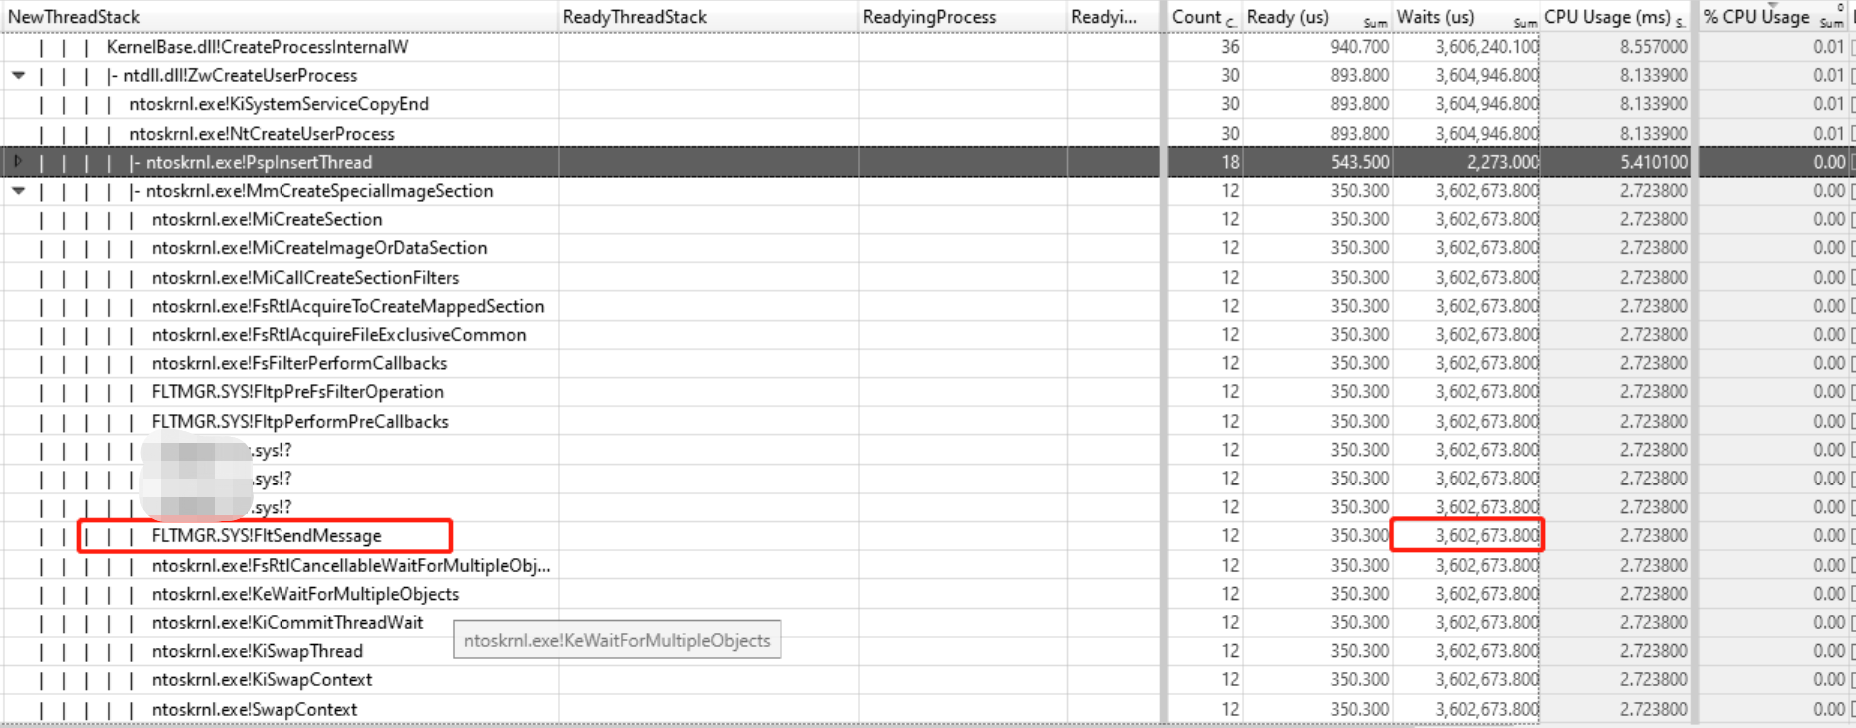
we can see, the bash.exe calls CreateProcess, in the kernel, MiCreateSection is called, then xxx.sys calls FltSendMessage to send a message and waits, FltSendMessage/FilterReplayMessage is the infrastructure provided by Microsoft for minifilter, drivers can call FltSendMessage to send messages to user applications, and user applications use FilterGetMessage to get messages and FilterReplyMessage to reply to the drivers, and last FltSendMessage return. we can see the whole process costs 3.6 seconds, the bash.exe creates several child bash.exe, the total time cost is 3.6 seconds
The powerful part is, not only can WPA tell you what the thread is waiting for, but also it can tell you which thread wakes it up.
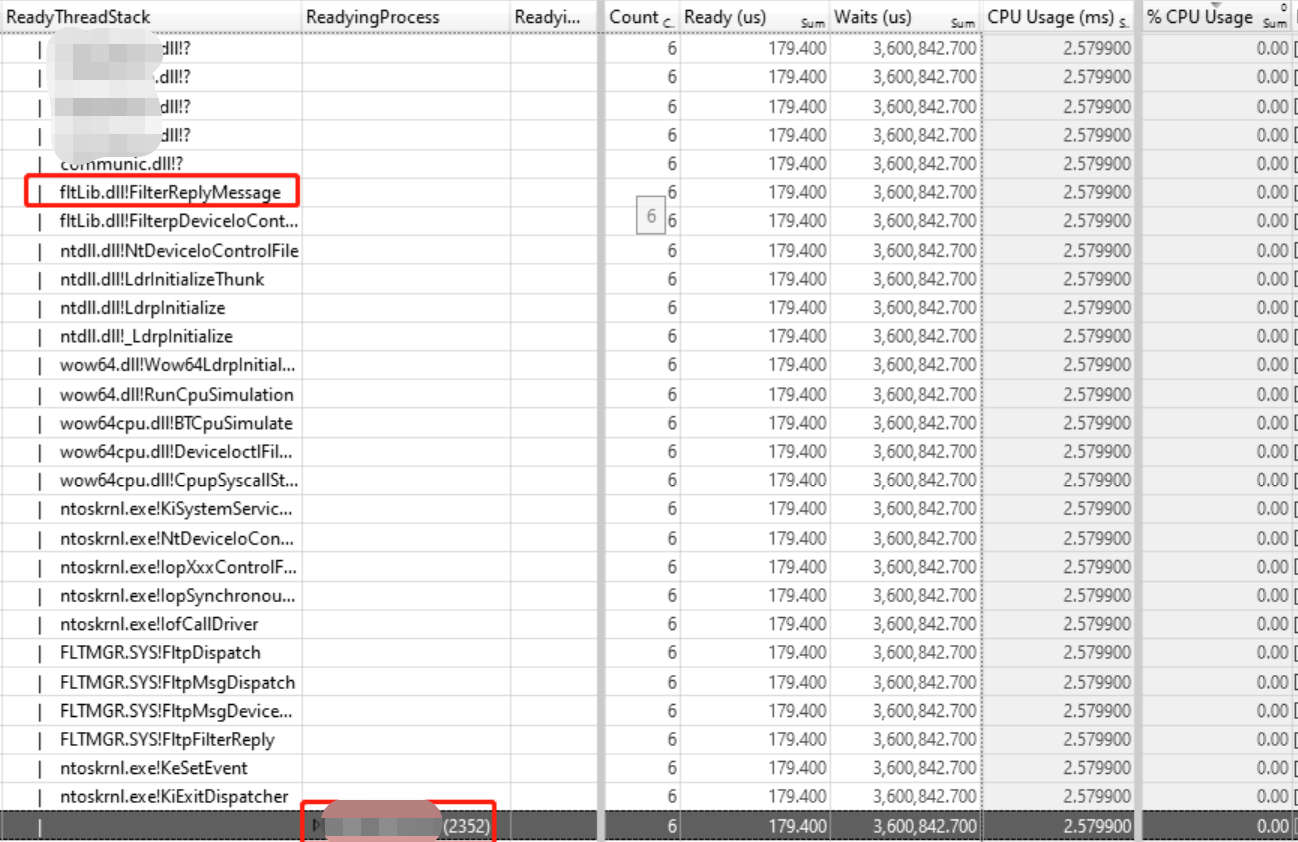
A thread whose start address lies in xxx.dll calls FilterReplyMessage to wake the xxx.sys, and the thread belongs to process xxx.exe(pid 2352), then CreateProcess can continue to execute.
xxx.exe (pid 2352) is a popular anti-virus software, xxx.sys is the minifilter driver of the anti-virus software, of course for security, it is reasonable to intercept process creation, but the time cost is unbearable.
Enable anti-virus software VS Disable anti-virus softwre
Here are two gifs to show the different experience when enable/disable anti-virus software
enable anti-virus software:
We can see clearly that the cursor stops for a while at the start of next line when I hit enter.
disable anti-virus software:

After disabling anti-virus, the operation is more smooth.
And when I enable the anti-virus software, CreateProcess costs 611 milliseconds
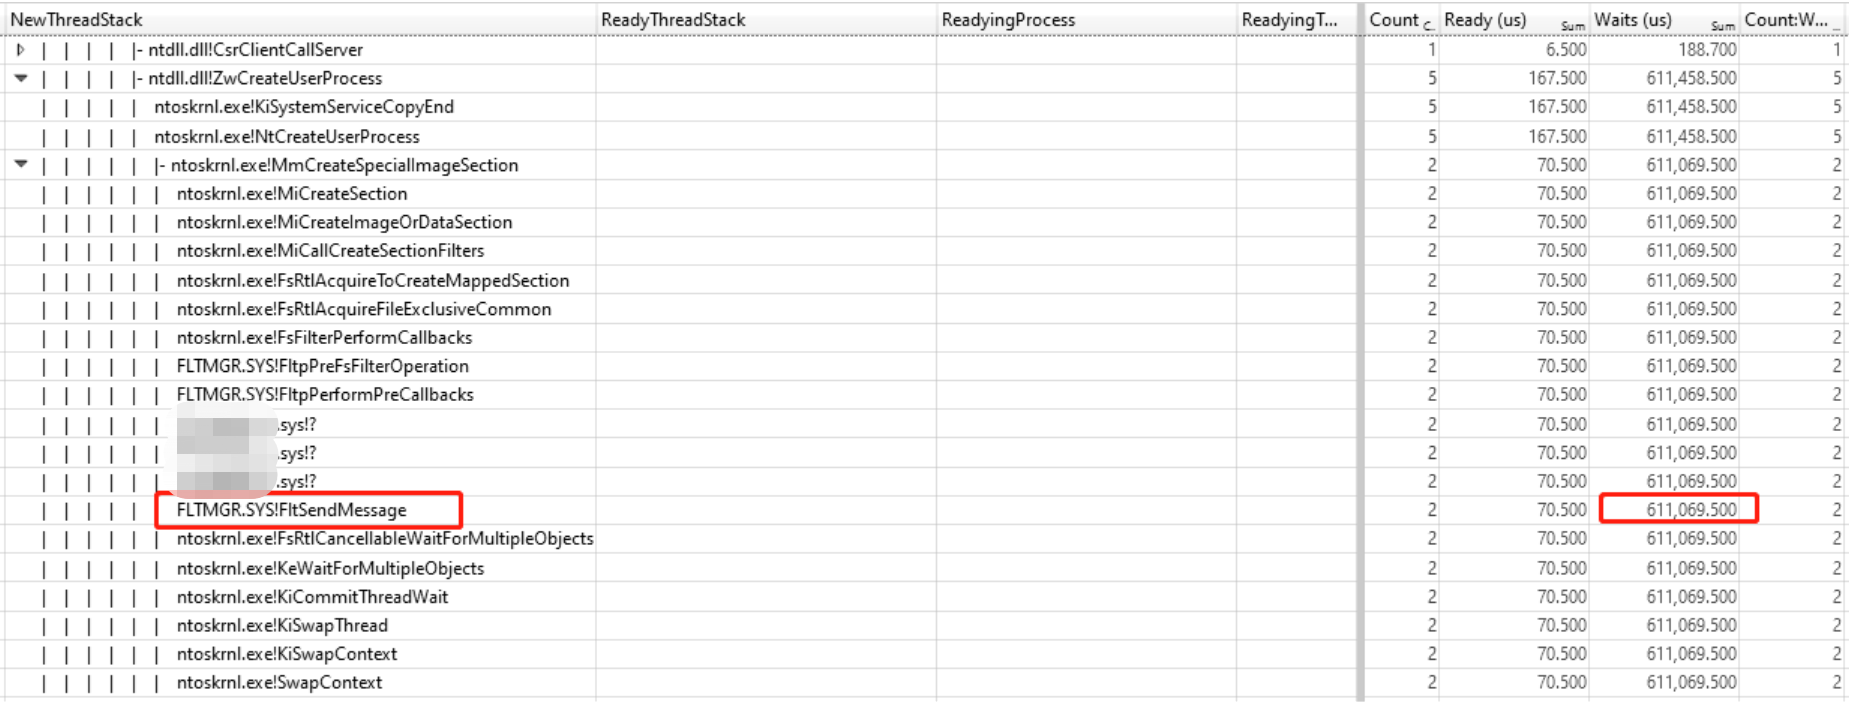
After I disable the anti-virus software, CreateProces only costs 72 microseconds, over 8000 times faster!!!